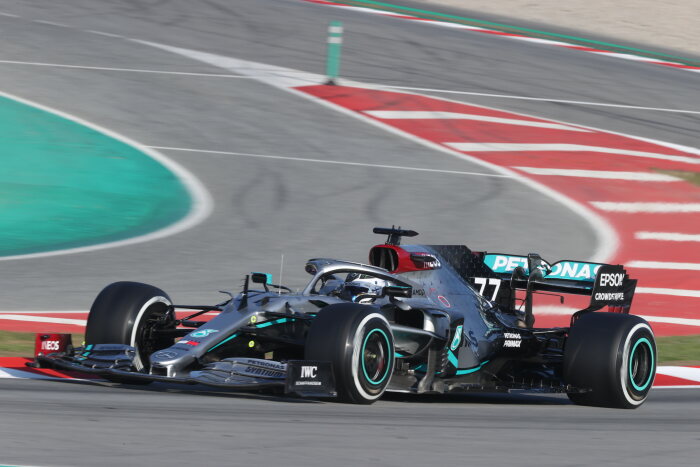
First pre-season test of 2020 F1 season concludes with 138 laps for Mercedes-AMG Petronas F1 Team on day three
Date: Friday, 21 February 2020
Driver: Valtteri Bottas (AM), Lewis Hamilton (PM)
Circuit: Circuit de Barcelona-Catalunya
Circuit Length: 4.655 km
Laps Completed: Valtteri 65, Lewis 73 Total 138
Distance Covered: Valtteri 303 km, Lewis 340 km, Total 643 km
Best Lap Time: Valtteri 1:15.732, Lewis 1:16.516
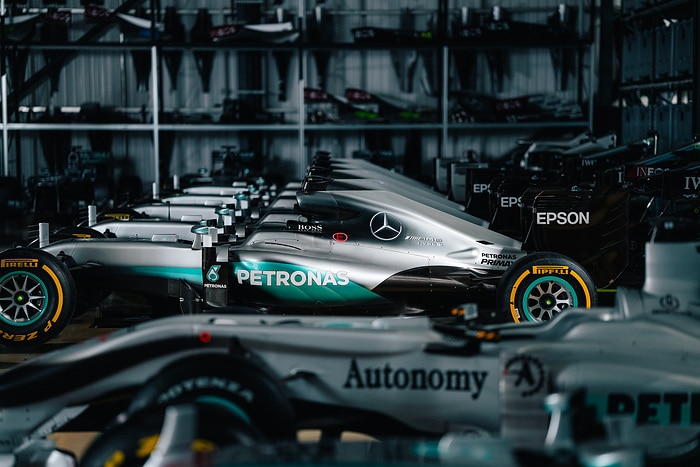
The Mercedes-AMG Petronas F1 Team wrapped up the first of two pre-season tests at the Circuit de Barcelona-Catalunya with a productive third day of running for the new F1 W11 EQ Performance – completing 643 kilometres.
- Valtteri was at the wheel for the morning session and topped the timesheets for the day, with the Finn focusing on aero data collection, shorter runs and set-up work
- Lewis returned to the cockpit of the W11 for the afternoon, also concentrating on aero data collection and shorter runs, while also working on race start procedures
- Today’s programme focused mainly on aero data collection and set-up work as well as practicing race start procedures
- Mercedes-Benz Power Units completed a total of 1,518 km today
- Rights-free imagery of the day is available on our media site
- To download all available imagery from today with just one click, please use the following link (please note that imagery will download in a zip folder): Image slection
- The F1 W11 EQ Performance will return to the track at the Circuit de Barcelona-Catalunya next week, with the second pre-season test starting on Wednesday 26th February
Lewis Hamilton
It’s been a great effort from the team and great to see that the reliability is as strong as it is. The car has felt pretty good out there. It’s been a solid first week and we’ve got some good mileage. It’s a true showing of all the incredible work everyone has done back at the factory and here at the track. I’m really proud of everyone. We’ve got to keep working hard, analyse all the data from this week and figure out how we can move the car forward and build on everything next week.
Valtteri Bottas
It’s been really fun today, especially getting to do some shorter runs and being able to push the car a little bit closer to the limits – seeing a little bit more of the performance of the car. I enjoyed it and it felt really good out there. It feels like we made a step with the set-up since yesterday. The car is very driveable and I’m sure with some more hard work next week, we can make it better, which will be the goal. Overall, it’s been a really good first test, we have made some improvements every day with the car. A big well done to every single team member to deliver the car and engine – great job! I’m looking forward to getting back in the car next week.
James Allison
After the brief hiatus of yesterday, it was good to get a solid day of uninterrupted, reliable running today. Both drivers completed a programme of set-up work and an early look at the softer compound range. Just a very quick glimpse of that, but really useful preparation for the second week of testing where we have more of the soft rubber to bring. It’s been a good first week, the car has been broadly reliable, and the performance has been reasonably good throughout the week. There are, of course, many things to work on and we’ll be trying to do that in week two. But it’s a really good baseline. At the end of this first week, we start to get some sort of feeling for where all the teams are in the pecking order and especially now a few race distances have gone down. But it will be really interesting in the second week as our estimates start to refine further.
Featured today: What we’ve learned from the first week of testing
“You can’t learn anything from laptimes during testing”. This phrase is often heard during the winter and repeated so often that it has become more or less accepted as fact. But is it true? Try telling it to the Team Strategists and see their response.
Far from discounting testing time analysis as meaningless, every team in the pitlane pores over the data as it emerges in order to build up a picture of the competitive pecking order. Using techniques that have been built up over a number of seasons it is possible to figure out, with surprising accuracy, what lies beneath the headline laptimes that we see during winter testing.
It is true, of course, that the strategists face a considerable string of unknowns. Fuel load, engine mode, tyre performance and driver pushing level play havoc with the laptimes and all of them are either unknown, or partially known. However, testing times are far from meaningless. If you look at them long enough, they gradually give up their secrets.
We start from things we do know. We know the lap time. We know the number of laps. We know (with good accuracy) the fuel that will be burnt in every lap. We know (from our simulations) how much faster a car will go with each lap of fuel that it burns. We also know (with adequate accuracy) how much slower a tyre will get with every racing lap that it is subjected to. We have estimates of the laptime difference between all the tyre compounds which gradually get more and more accurate as the test proceeds. With this in our hands, we can start to calculate things.
Although it might seem strange, the habits of teams are quite sticky. They tend to do similar things each year. Most people will run three fuel levels: a lower fuel load for performance, a medium fuel load for the bulk of their work, and full tanks for their race simulations. For each team, these three levels are different, but, weirdly, they don’t vary much from year to year. Our opening guesses will assume that each team will do the same as they did the year before.
If you have a set of test times for the grid, and you have a set of opening assumptions (guesses) for which one of these three fuel loads each car has run, then you can convert the raw leaderboard into a pecking order. Of course, this first estimate is very inaccurate. The resulting pecking order is largely a reflection of the quality of the opening round of guesses – If you thought a team was on, say, 50kg, when, in reality they were on 100kg, then you will seriously underestimate their pace.
However, as the runs keep coming and the days unfold, this estimate is progressively refined using a simple method to keep adjusting the lower bound of the fuel that must be in the car. We do this by counting the laps. If a car does a 10 lap run, then we know that a lap consumes (say) 1.7kg, then there must have been at least 17kg of fuel in the car to do that run. In reality, teams do not like to run down to fumes in normal testing, so it is more likely that there was at least 27kg of fuel in the car. If our prior assumption was that this team normally runs 50kg for general testing, then we will adjust our initial guess to say that the car was likely to have somewhere between 27kg and 50kg of fuel in the car. Once a team has done a load of running, this estimate gets surprisingly accurate.
If we see a car jump up or down in pace by meaningful amount, then we will tentatively conclude that this was a jump to one of the other fuel loads. For example, if it gets a chunk faster, we can assume that this was an adjustment to the “performance” level for a run that will be nearer to a qualifying effort.
The real insight comes when a team attempts a race distance. Doing a full race distance with pit-stop style tyre changes implies that the team must have its tanks near to full. This narrows the error in our estimates dramatically, allowing race times to be compared more or less directly.
Alongside the gradual capture of the testing fuel levels, the strategists are watching the speed and acceleration traces that come from the GPS system to look for changes in PU power. As the teams cycle through the power modes, we can get estimates of what power levels are available to each type of PU, and when they have been employed. This allows us to refine the pace estimates for each team, correcting for the mode usage in each run.
At the end of the first day, a hazy pattern is present. By the end of the first test, that pattern comes into better focus.
What, then, can we say about the leaderboard after three days? This is where life gets tricky because all these estimates are lower bound estimates. You can say with some confidence that your competitors are “at least as fast as X”, but you do not know for sure how much faster they could have gone. No-one wants the egg on their face of claiming that they are faster than another team, because they can never know for certain what was hidden or what is coming next. For example, will Red Bull bring a significant upgrade package to the second test? Why have Ferrari spent this test running their PU consistently at much lower levels than their partner teams?
What we can say is that we predict the battle in Melbourne at the front is going to be tight. We can also see that the midfield have closed on the front and that there is some considerable midfield swing compared to last year’s competitive order. Testing times are not meaningless, they are a goldmine, if you’re prepared to sift through them with care and caution until a clear picture begins to emerge…
|
Position |
Driver |
Team |
Best Lap Time |
Laps Completed |
|
1 |
Valtteri Bottas (77) |
Mercedes-AMG Petronas F1 Team |
1:15.732 |
65 |
|
2 |
Lewis Hamilton (44) |
Mercedes-AMG Petronas F1 Team |
1:16.516 |
73 |
|
3 |
Esteban Ocon (31) |
Renault |
1:17.102 |
76 |
|
4 |
Lance Stroll (18) |
Racing Point |
1:17.338 |
116 |
|
5 |
Daniil Kvyat (26) |
AlphaTauri |
1:17.427 |
62 |
|
6 |
Antonio Giovinazzi (99) |
Alfa Romeo |
1:17.469 |
152 |
|
7 |
Daniel Ricciardo (3) |
Renault |
1:17.574 |
93 |
|
8 |
Max Verstappen (33) |
Red Bull |
1:17.636 |
86 |
|
9 |
Pierre Gasly (10) |
AlphaTauri |
1:17.783 |
59 |
|
10 |
Alex Albon (23) |
Red Bull |
1:18.154 |
83 |
|
11 |
Carlos Sainz (55) |
McLaren |
1:18.274 |
76 |
|
12 |
Romain Grosjean (8) |
Haas |
1:18.380 |
48 |
|
13 |
Sebastian Vettel (5) |
Ferrari |
1:18.384 |
100 |
|
14 |
Lando Norris (4) |
McLaren |
1:18.454 |
49 |
|
15 |
Nicholas Latifi (6) |
Williams |
1:19.004 |
72 |
|
16 |
Kevin Magnussen (20) |
Haas |
1:19.709 |
4 |
Source: Mercedes-Benz F1